Five Google Ads Predictions to Test by the End of 2027
Five dated calls on Search structure, learning phases, setup advice, YouTube frequency and agency fees, with a test for each one.
September 26, 2026
•
min read



The real YouTube ad-load scandal is paying to reach the same viewer eight times while a frequency setting looks reassuring. Yes, YouTube has more ads in 2026. Viewers can see that without opening a campaign report.
What was once a single pre-roll can now be two unskippable ads back-to-back, with more mid-rolls and 15- to 30-second breaks inside a ten-minute video. I understand why people are searching for the ad count. I am more interested in the bill. More slots give an advertiser more chances to reach someone, but also more chances to pay for someone they have already reached. A report that says reach is rising does not settle which one happened.
Say you spend $20k a month against a narrow audience. Your monthly readout leads with reach up 40 percent. Buried farther down, average frequency is climbing. You are not paying for a neat procession of new people. You may be buying the same available people again, then calling the extra impressions scale. More inventory with softer frequency controls is an expensive combination. The ad-load question gets the outrage. The frequency question gets your money back.
That is the mismatch I want on the first page of an account review: not just how much video YouTube served, but how much of it went to people the campaign had already paid to reach. Those are different accomplishments. One can rise while the other stalls.
A standard frequency cap is wonderfully unromantic: set a limit and, for the eligible non-guaranteed line item, serving stops when a user reaches it. It is a brake. You do not have to admire the algorithm’s intentions to know what the setting is meant to do.
A monthly frequency target is different. YouTube can optimize toward 4 to 8 impressions a month rather than enforce that number as a hard stop for each person. That makes the setting an aim, not the old brake with a friendlier label. An average can look sensible while individual viewers get more. Put that target beside a small audience and a steady budget, and the repeat impression becomes the easy impression.
This distinction matters because the account can contain more than one approach. Video campaigns can use target frequency up to four per week to pursue unique reach at that goal. A standard cap, where available, does something else. Demand Gen requires its own reach-versus-frequency monitoring rather than a frequency cap. Saying “we set frequency” without naming the campaign and the setting tells me almost nothing.
I used to tell clients frequency was set-and-forget. I was wrong. That advice assumed the number in the settings behaved like a ceiling everywhere it appeared. It does not. If you cannot say which campaigns have a hard limit, which have a target, and which you are watching manually, you do not have one frequency policy. You have three kinds of exposure sharing a slide in a report.
And the slide matters. A target that sounds conservative can be repeated in a meeting as though it guarantees what each viewer experiences. By the time anyone checks the delivery, the campaign has spent money under an assumption nobody wrote down. Name the setting accurately before you decide whether the result is surprising.
The practical question is not whether YouTube can find another place to put your ad. It can. The question is what stops your budget from taking that place when it belongs to someone who has already seen the creative several times. Check the mechanism before you congratulate yourself on the reach.
Repeat impressions can be cheaper than finding a new viewer. They can also keep view-through numbers moving. Put those together and a blended CPA may look calm while unique reach stalls. That does not prove every repeat was wasted. It does mean CPA alone cannot tell you whether the campaign is expanding its audience or circling it.
Imagine the familiar account review: impressions up, views up, CPM down. Someone calls it momentum. Then you put Unique reach beside Avg. impression frequency per user and see the missing half of the story. If the first number has been flat for two weeks while the second keeps rising, the campaign is doing more work on the same people. The dashboard can be green. The audience can still be tired.
This is where the monthly average earns its keep as a distraction. Four impressions per month sounds restrained when spoken aloud. It tells you less about the people at the high end of the distribution, and less still if you read it without looking at the period and the campaign. I want the weekly view as well. A month is a long time to discover that a tight pool saw the same creative too often in its first seven days.
I am not arguing that the second impression is bad and the first is good. I am arguing that a campaign needs an answer to a simpler question: what is the extra exposure meant to accomplish? If nobody can answer that while frequency rises, a decent CPA is doing too much work in the conversation.
Do not let a stable CPA end that conversation. Put unique reach and average frequency beside it, over the same dates, before deciding the spend is working.
I have sat through the readouts that lead with reach up 40 percent. Reach. Impressions. Video views. All up, laid out in the kind of deck that makes every line look like a promotion. Frequency gets page nine, if it gets a page at all. The person paying the invoice is expected to infer that “more” means “more people.”
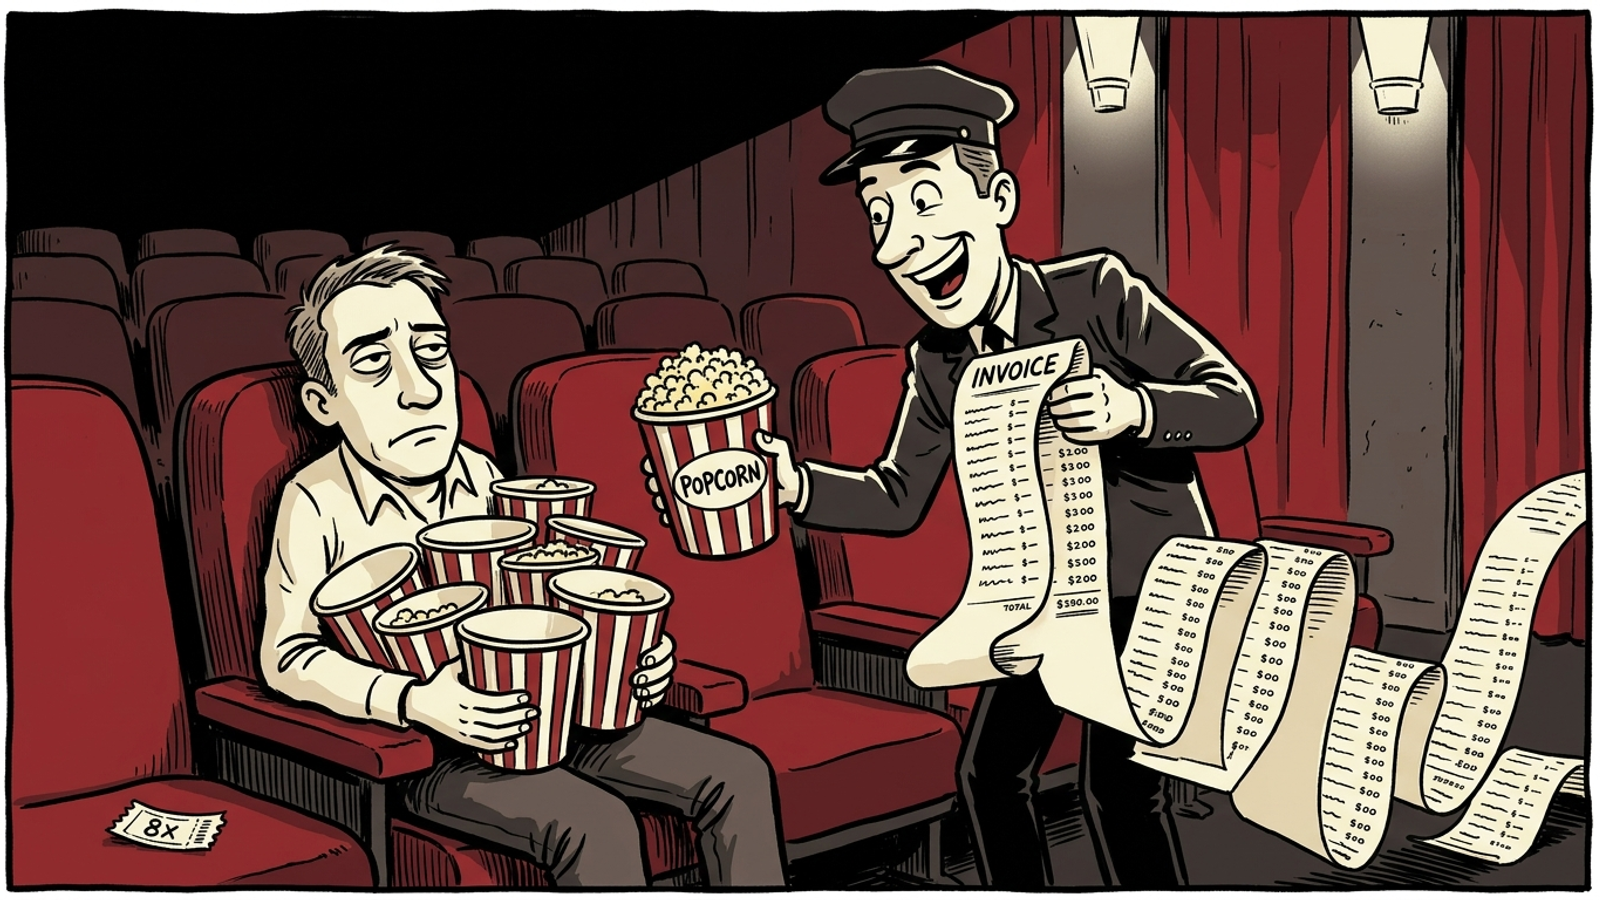
It may not. Reach is a useful measure, but it is not permission to ignore how often the reached audience sees the ad. Show me reach and frequency together. Show me whether a cold prospecting line is reaching new people or giving familiar ones another chance to memorize the skip button. What the deck calls incremental scale, I call buying the same viewer lunch eight times and counting eight customers.
There is a human reason this keeps happening: the familiar metrics make a tidy story. A campaign that keeps serving a reachable audience produces activity you can put in a report. A campaign that needs a wider audience, a different exclusion, or less budget produces a less comfortable conversation. The settings panel does not force anyone to have that conversation. Neither does a green CPA tile.
The order of the numbers does some of the selling, too. Lead with impressions and views, and frequency sounds like a footnote. Put frequency next to unique reach, and it becomes a question the room has to answer. I do not need another chart designed to make delivery look busy. I need to know who saw the ad again.
I get why viewers are angry about ad load. I watch with a phone in my hand, waiting to hit Skip, too. But outrage at the number of ads will not catch a narrow B2B audience being served the same creative again and again. Nor will an audit that checks bids, copy, and landing pages but never asks who got the repeat impressions. If the weekly report hides frequency, it hides the part you can act on.
Forget the petition about too many ads. Make one settings pass, one exclusion pass, and one reporting pass. This is not a grand new strategy; it is how you find out whether the account is buying reach or buying repeats. Run the checks in order, because an average-frequency number is harder to interpret when you do not know what the campaign was instructed to do.

That last item is the one I expect to meet resistance. “Reach up, views up, CPM down” reads beautifully until the next column says frequency 6.2. A flag is not a verdict that every impression beyond it was worthless. It is a demand for an explanation: did the campaign find a useful reason to show up again, or did the budget keep finding the easiest available viewer?
The checks are deliberately plain. None asks you to decide from a single number that the campaign has failed. They ask you to stop treating three different frequency mechanisms as one setting, overlapping audiences as new prospects, and a monthly average as the full account of what people saw. That is a smaller job than fixing the whole campaign. It is also the job an audit keeps missing.
Say you spend $20k a month. You do not need a heroic attribution model to see why that distinction matters. If the audience is narrow and repeat views are taking an increasing share of delivery while unique reach sits still, keeping the same budget in the same line deserves scrutiny. I would rather have that awkward conversation than celebrate another month of activity with no evidence that the audience grew.
YouTube has more ads in 2026. Get over it. The platform sells attention; inventory was always the visible part of this story. The part you control is whether your campaigns keep paying to visit the same viewer while someone presents the visits as growth. Check the setting, clean the exclusions, and read the frequency column before you read the victory slide.
This will not matter equally to every account. If you spend $50 a day against a broad audience, frequency may not be your first leak. If you put four figures a month into a tight pool, a remarketing list, or a narrow B2B market, it belongs near the top of the audit. I check frequency before CPA now. groas watches it continuously rather than waiting for the next polished readout.
Eight visits to one viewer are not eight new customers.